MAP Accelerator
- Who it's forTeachers using the MAP diagnostic
- Team3 Product Designers, 8 Engineers, 3 Product Managers, 2 Analysts
- RoleProduct Design Lead
- EmployerKhan Academy
The Problem
Imagine this: Mrs. Espinoza is a 4th grade teacher in an inner-city school district in Clark County, Nevada. She’s got a class size of 40, and even though her school is common-core aligned, not every student is at a 4th grade level when it comes to Math and English Language Arts (ELA). In fact, the range is quite broad—some students are working at a 2nd grade level while others might be at a 6th grade level. How can she ensure to meet the needs of every student so that they can live up to their full learning potential?
This short anecdote is the reality of our school system today. In the past handful of years, we’ve seen class sizes increase as well as the gap in student ability. At the same time, teacher turnover rates in public schools are hitting new highs. How might we use technology in the classroom to better help teachers personalize the education experience for learners so that they can live up to their potential? This question sparked the inception for a new product between the non-profits NWEA and Khan Academy that I led the design for.
NWEA is a research-driven non-profit that creates one of the most prevalent assessments for students in grades 3–8. This assessment, called MAP Growth, is typically administered 3x per year and covers Math and ELA. MAP allows schools and teachers to assess students for growth and help them differentiate and adjust instruction for the ways material is taught in classes.
While MAP Growth is definitely helpful, teachers and school districts without a lot of resources are caught in a tough situation: they know the needs of their students but they don’t have the time and the means to offer them personalized help. This gap in the public school system served as fertile ground for a partnership to form between Khan Academy, an online platform for personalized practice in foundational skills, and NWEA. Together, we started asking the following questions:
- How might we help learners get the personalized practice they need to live up to their potential?
- How might we help teachers differentiate instruction without unnecessary friction?
- How might we help school districts integrate rosters and MAP Growth scores and then monitor progress?

Process & solution
The team targeted to have an alpha release ready for back-to-school 2019, and we agreed that the bulk of the experience would rest on the teachers. Our end goal was to have a pilot product called MAP Accelerator that 5 districts across the country would use. While this product included roles for district leaders, teachers and students, the district leader experience relied largely on a subset of the teacher experience and the student experience relied heavily on the existing Khan Academy learner experience. As Principal Designer, my role was to lead the end-to-end product design effort for the overarching teacher experience. It was a lot of work, but I’ll try to succinctly outline the steps.
Defining the constraints
We were under a really tight timeline and a brand new user base. While Khan Academy has worked with teachers before, teachers using the MAP test was an entirely new demographic! When we started collecting information on these teachers, we realized that they were all so very different. Diving into the data, my Product Manager and I decided it would be inefficient to craft personas but rather we should focus on the market segment we wanted to tackle: teachers with less than 5 years of experience who are new to MAP. Defining these user constraints, helped my team and I design for these teachers’ specific needs.
The technical & business side presented a hurdle that we also had to design around: rostering students would be a manual process between NWEA and the school district. A large part of the experience hinged on onboarding teachers and subsequently onboarding their students. In order to do this with minimal friction, it was essential for teachers to be able to get their class up-and-running as soon as possible. This meant having all of their students in MAP Accelerator from day one. The experience would need to be designed around this manual rostering process—I’ll dive into more detail on that in a bit.
Primary & secondary research
With Khan Academy’s reach, we were able to line up school visits immediately. We started by doing field research at a public school in inner-city Chicago where a teacher was diligently using MAP test data to manually assign content in Khan Academy for each student. While laborious, this teacher said it was really effective in helping him differentiate each one of his students. We also ran co-design and participatory design sessions with teachers and students to help give us additional information while we were there.
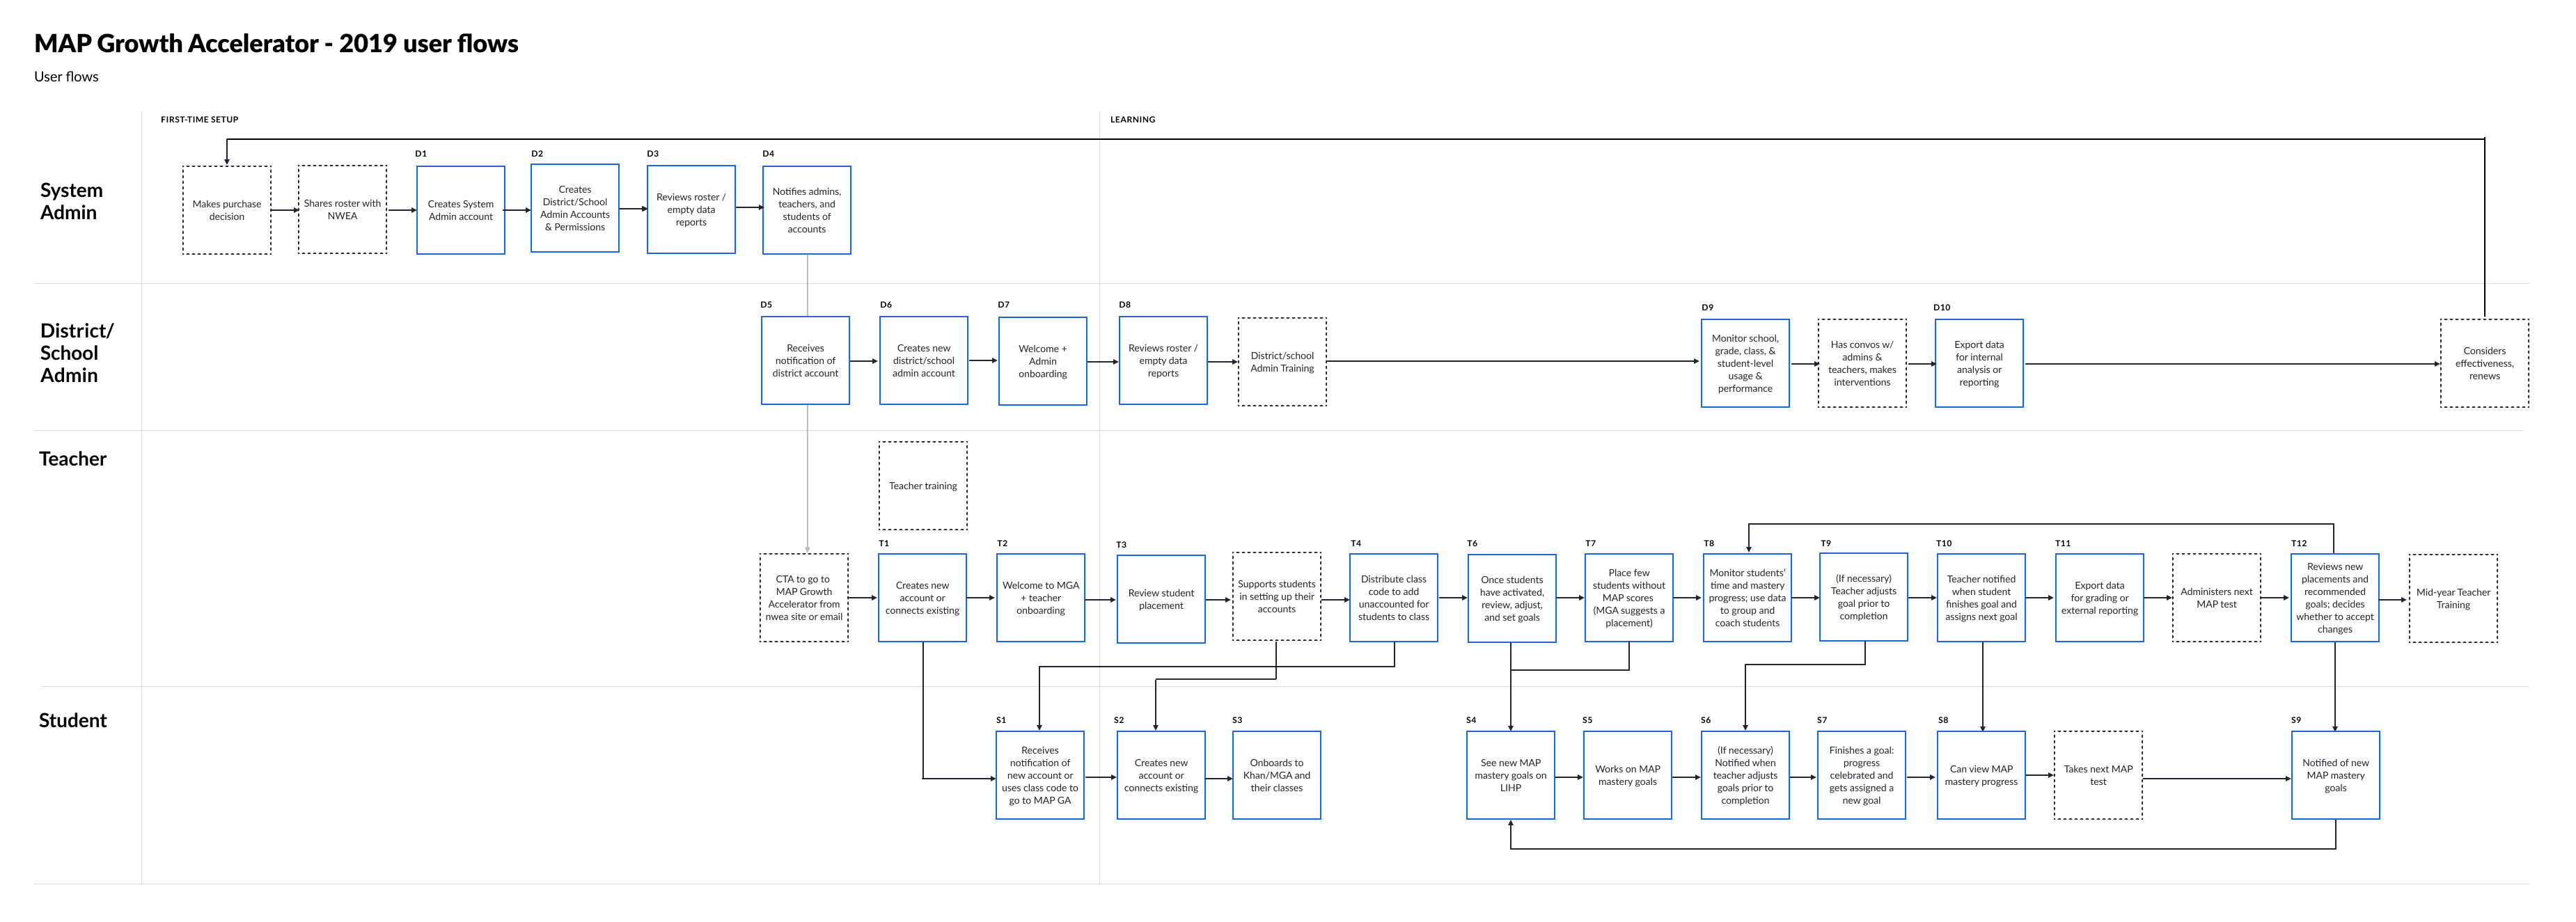
Around the same time, we began outlining the technical steps for rostering and the onboarding experience teachers would have. This work led us to create a high-level journey map of the experience for district leaders, teachers and students. We knew there would be a lot of behind-the-scenes sequencing of steps that would lead to a choreography of these unique user roles, especially as it related to onboarding new users.
Lastly, we conducted some secondary research through conference proceedings at ISTE, books, journals and blogs around personalized education. What matters most to teachers when they look for personalized edtech supplements in the classroom? This led us down a path of looking into how teachers use competitor software from Pearson, IXL and the like to integrate with test score data.
Findings
Through both the primary and secondary research we uncovered that teachers tend to conduct class with math instruction in three main ways:
- Teaching the whole class from a single lesson plan
- Putting small groups of students together who are at a similar level and giving them unique assignments
- Assigning personalized practice on an edtech supplement like Khan Academy
With this research and our technical infrastructure, we blocked out the experience into a few major components:
- Rostering & onboarding
- Placement & assigning content
- Reporting & adjusting placement
You can see these specific steps in more detail on the following user flow:
Iterating on prototypes
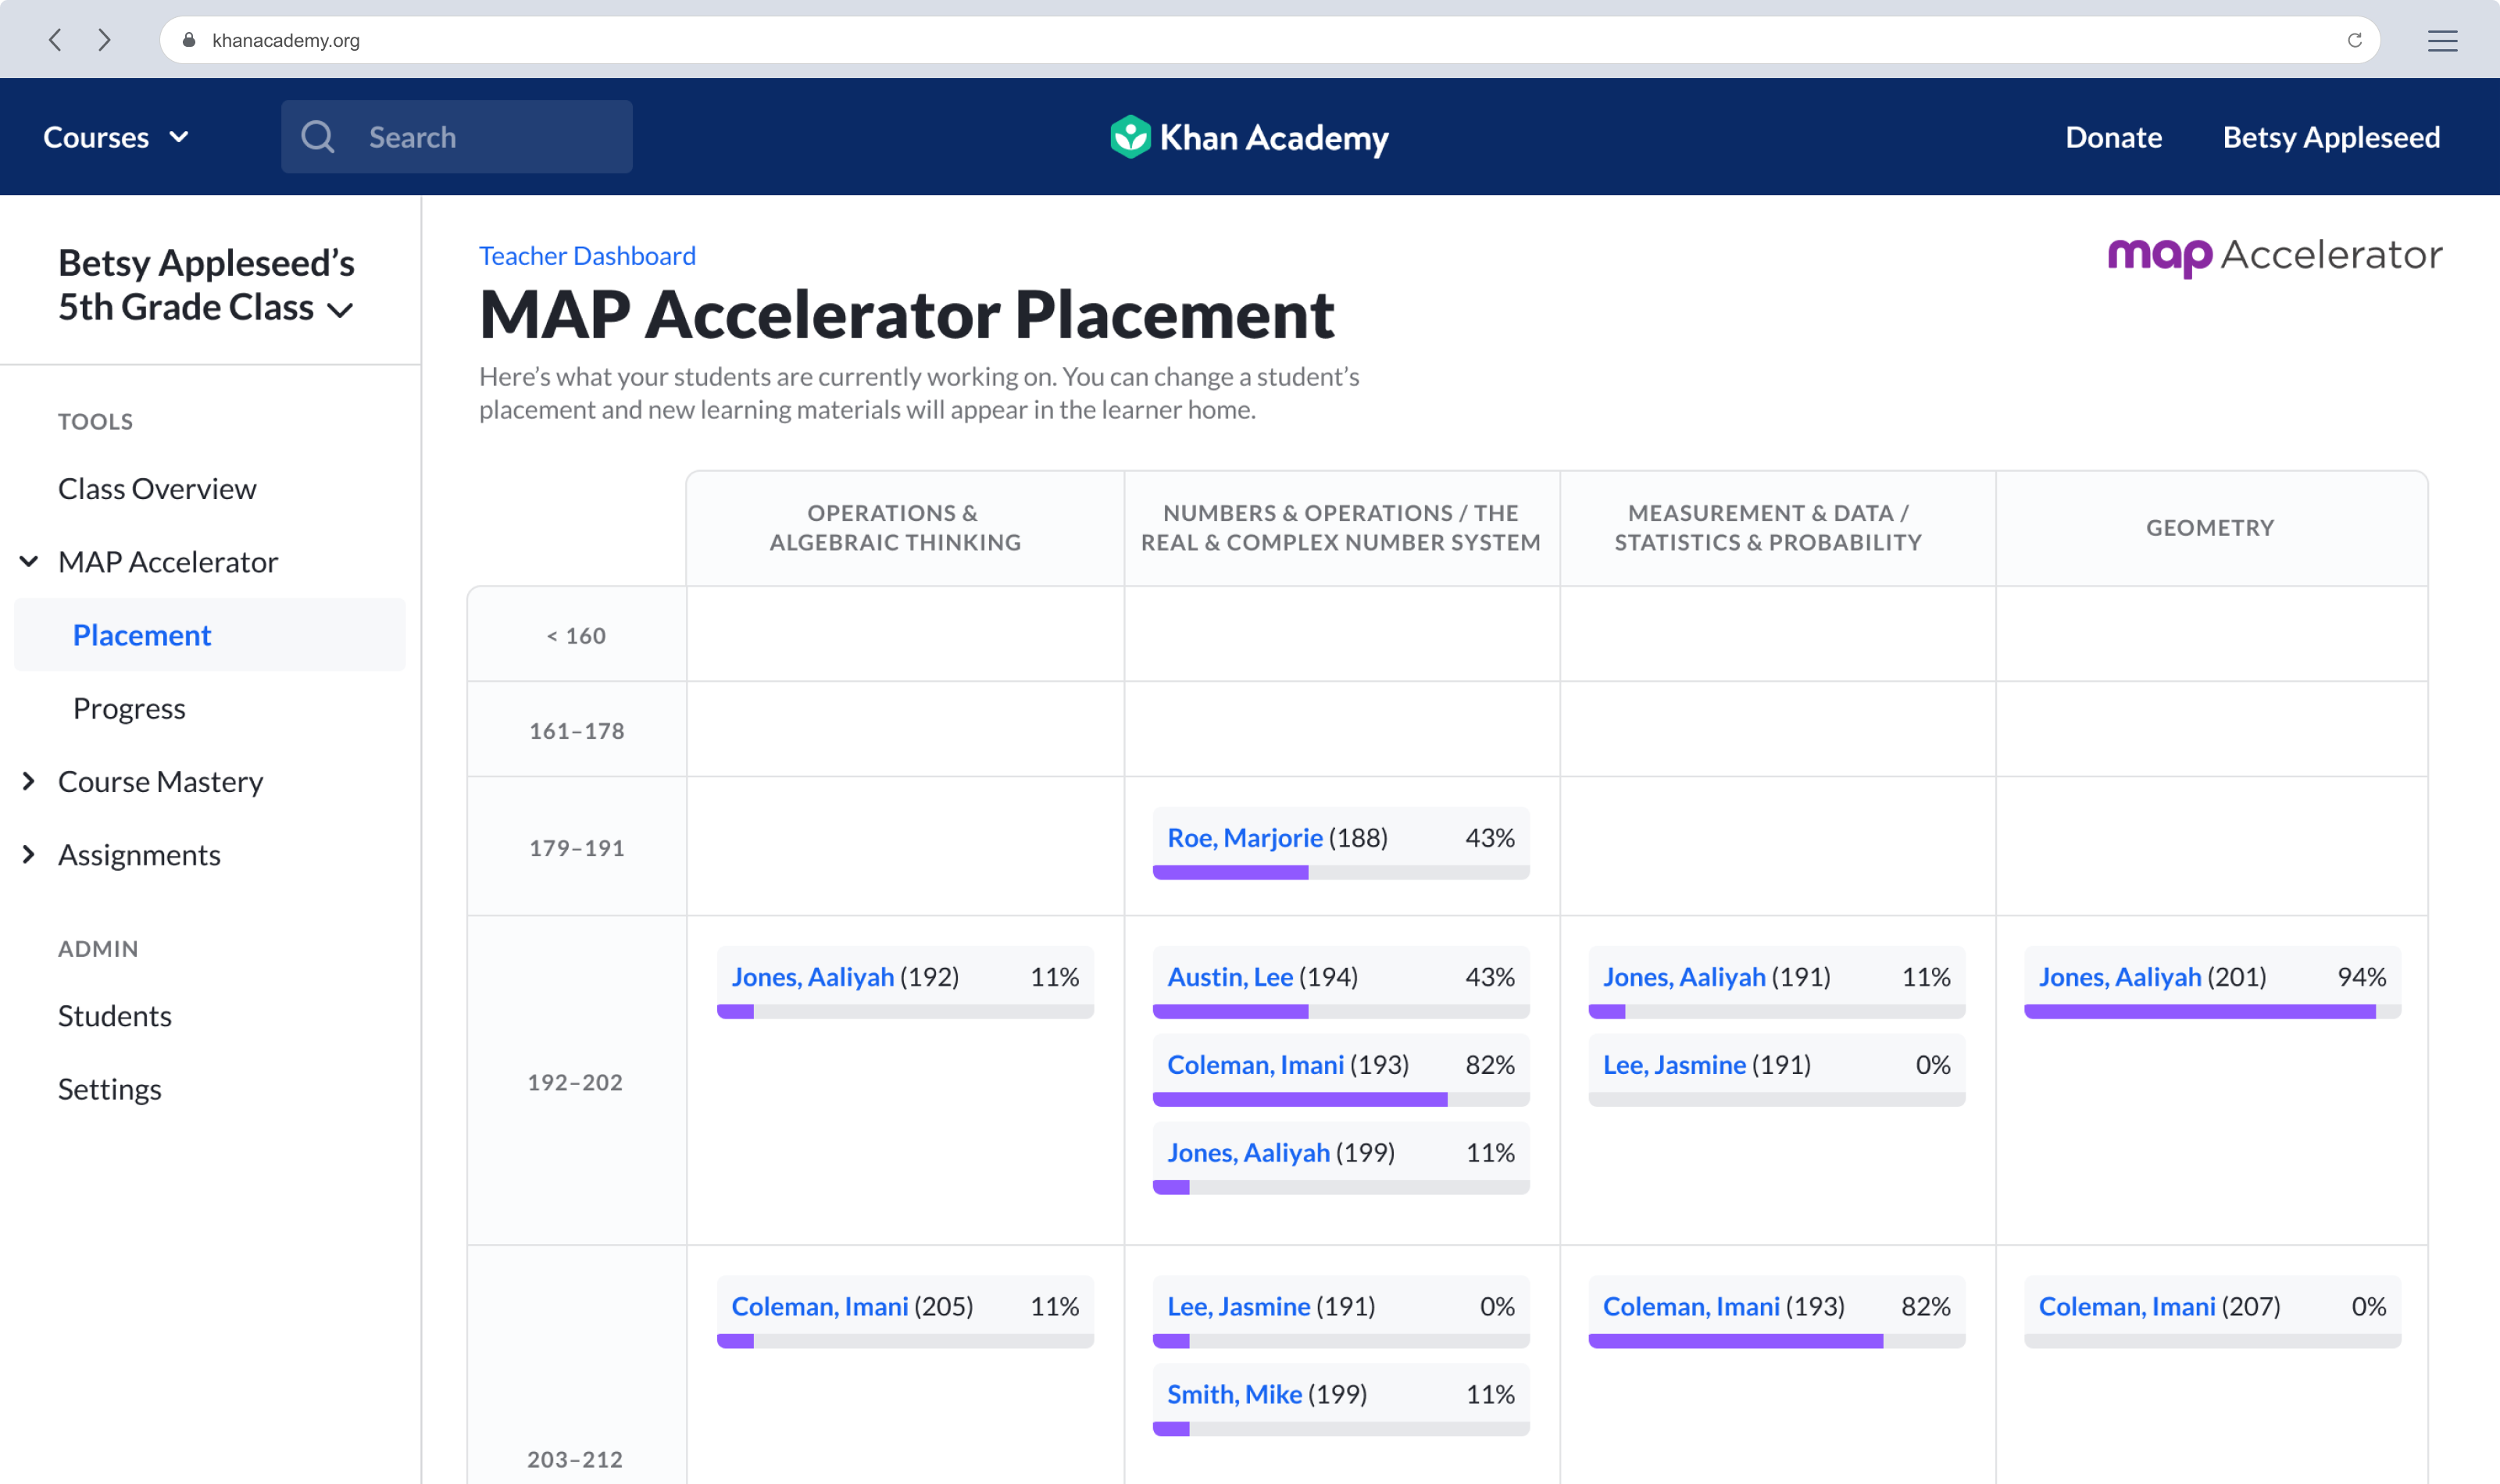
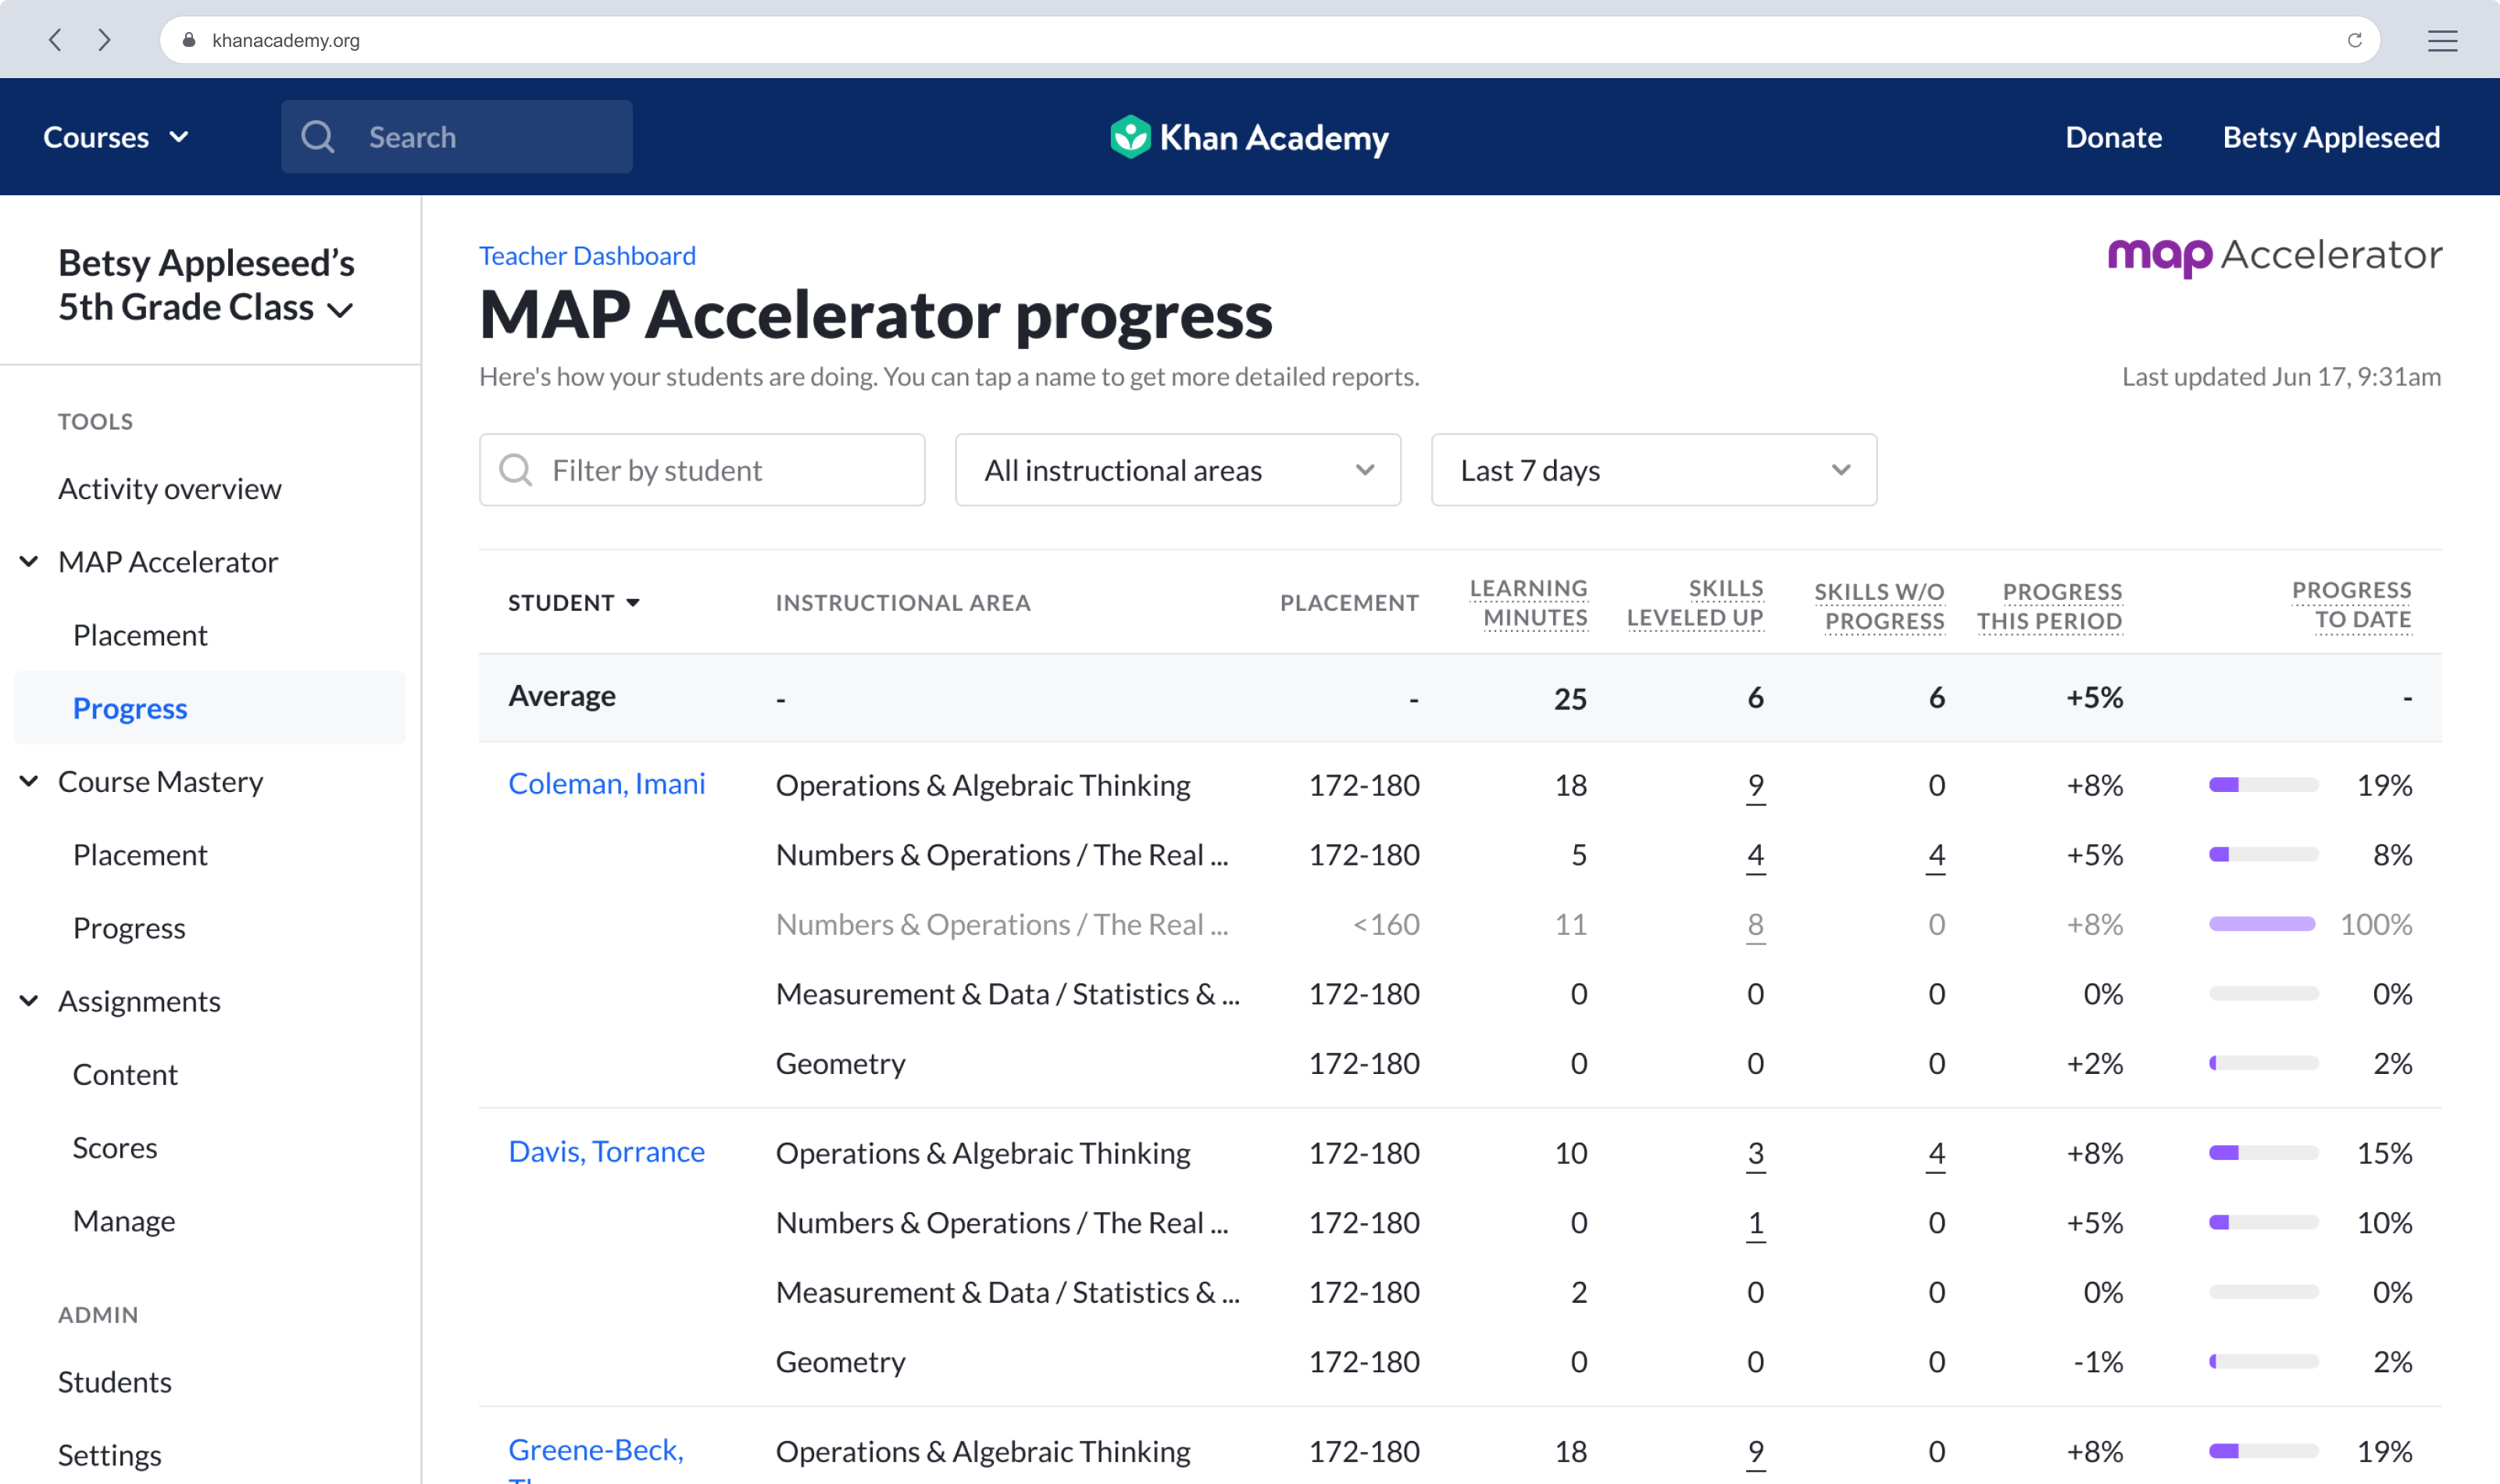
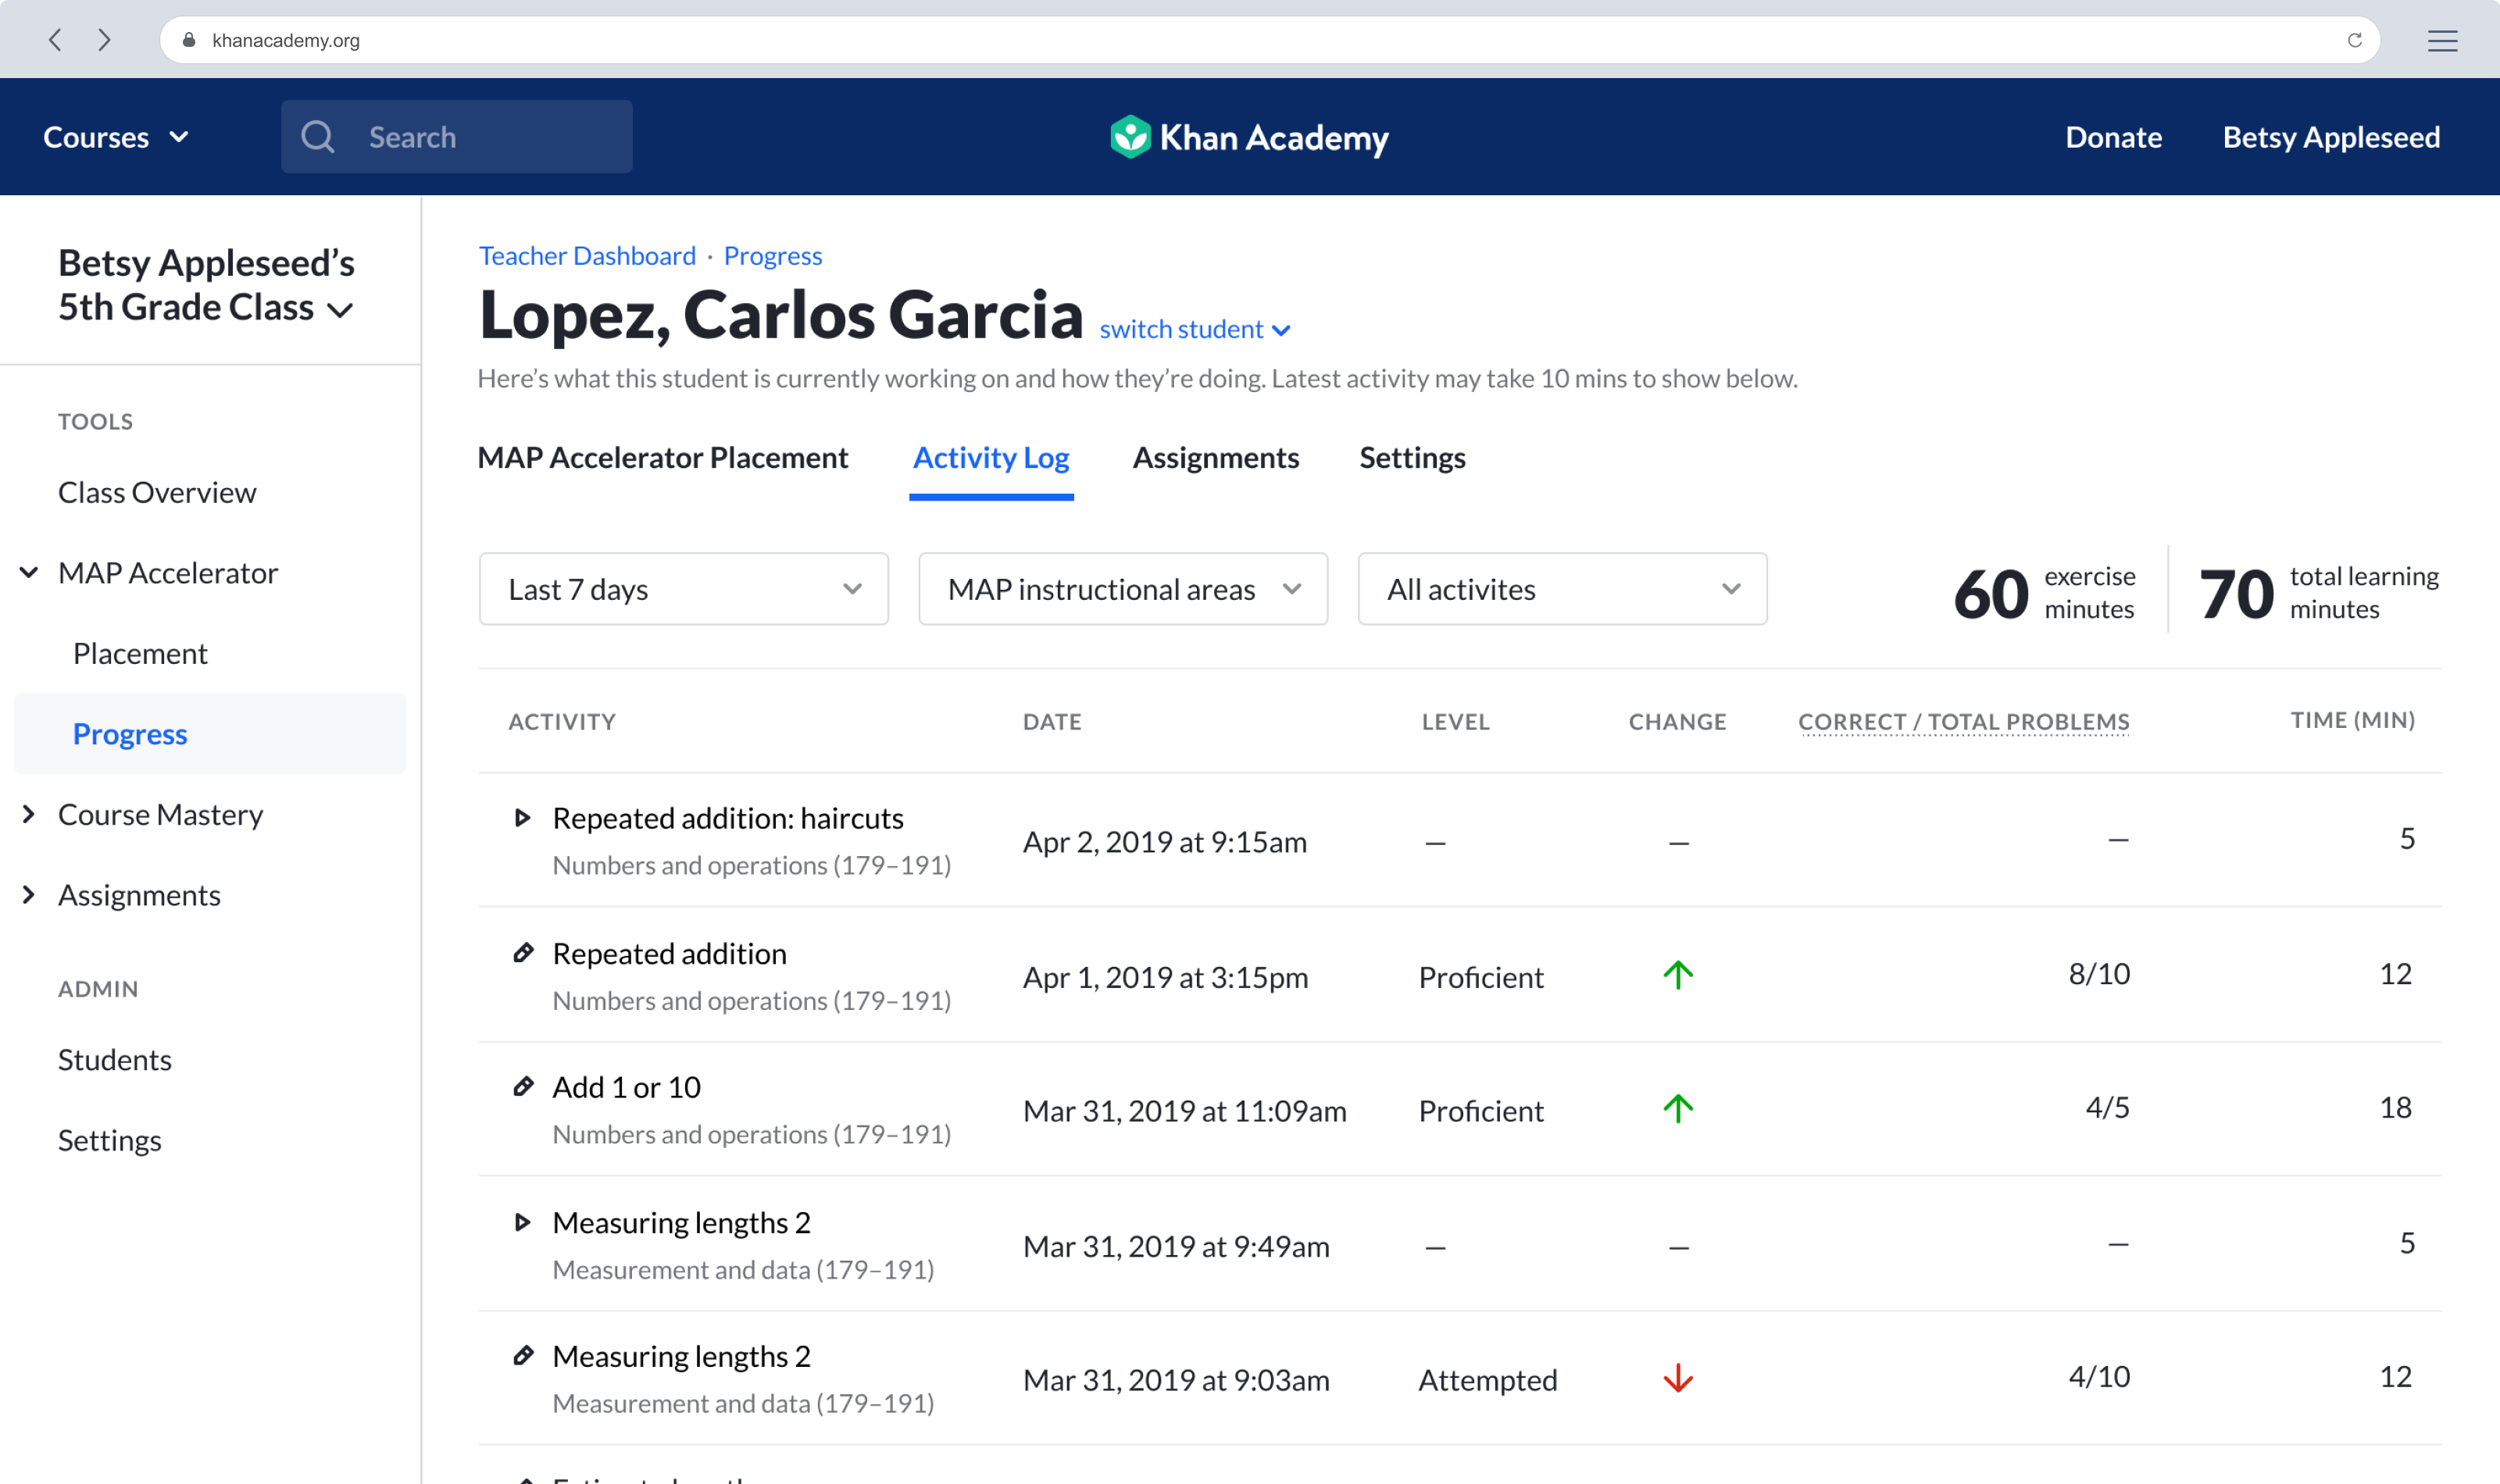
Armed with this high-level flow, we could now begin iterating on specifics with teachers. Placement emerged as a crucial part of the onboarding experience. In the Placement phase, a teacher would be able to see the student’s MAP score in an instructional area from their most recent test and assign Khan Academy content that is associated with that score range. This step would happen in tandem with rostering. Upon placing a student, the teacher would then be able to view a report that gives a high level overview of where each student is at with respect to each instructional area in Math. We sketched out numerous versions of this report and hopped on video calls with teachers around the country.
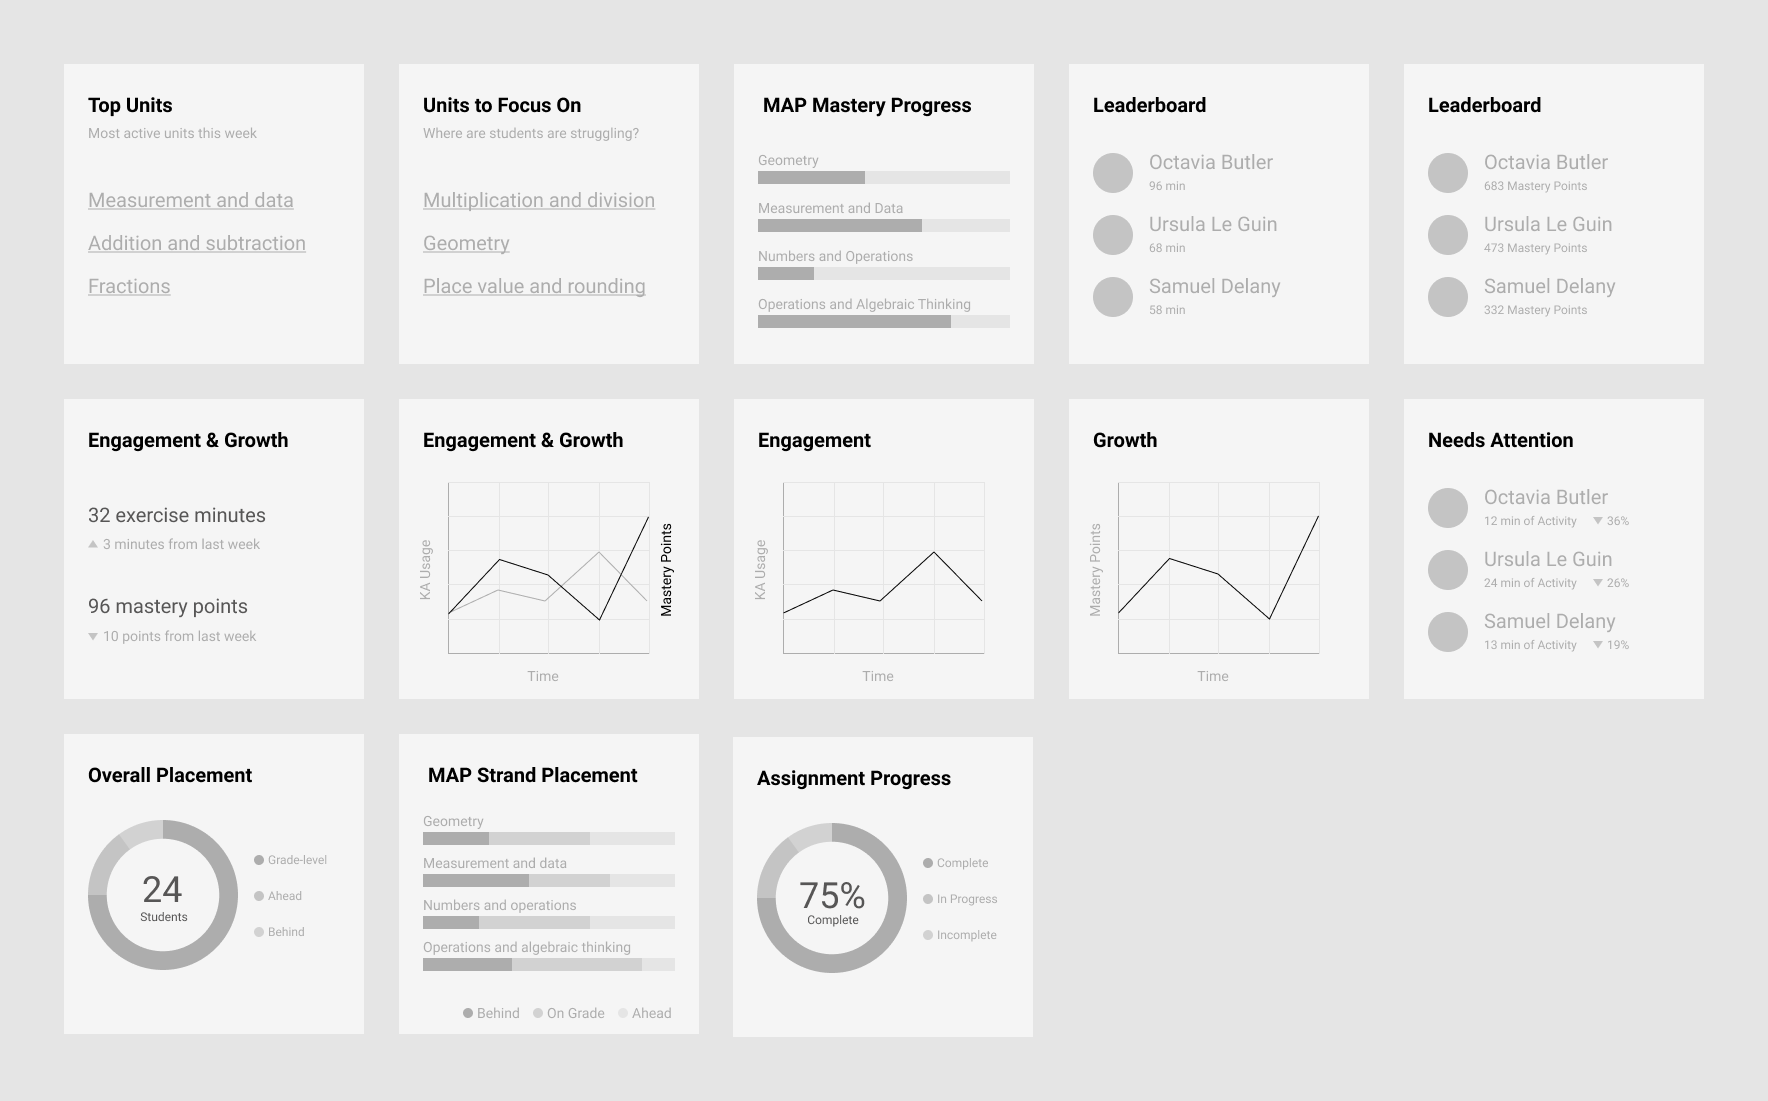
Here are some of the approaches we tried:
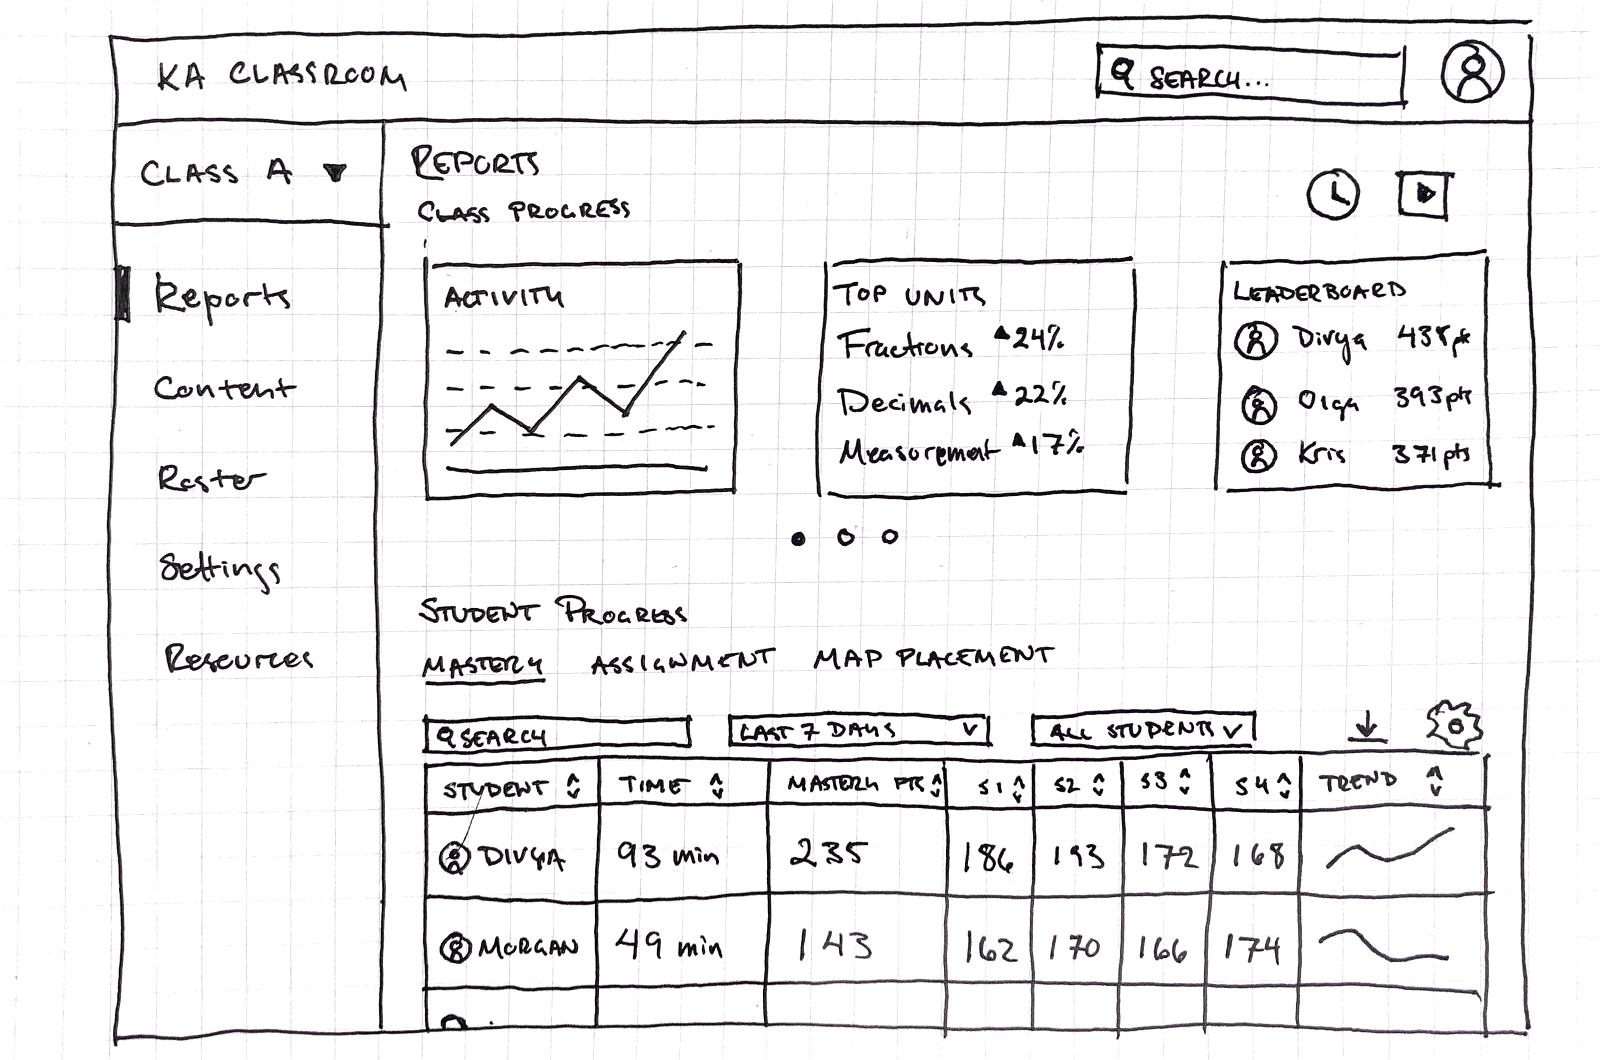
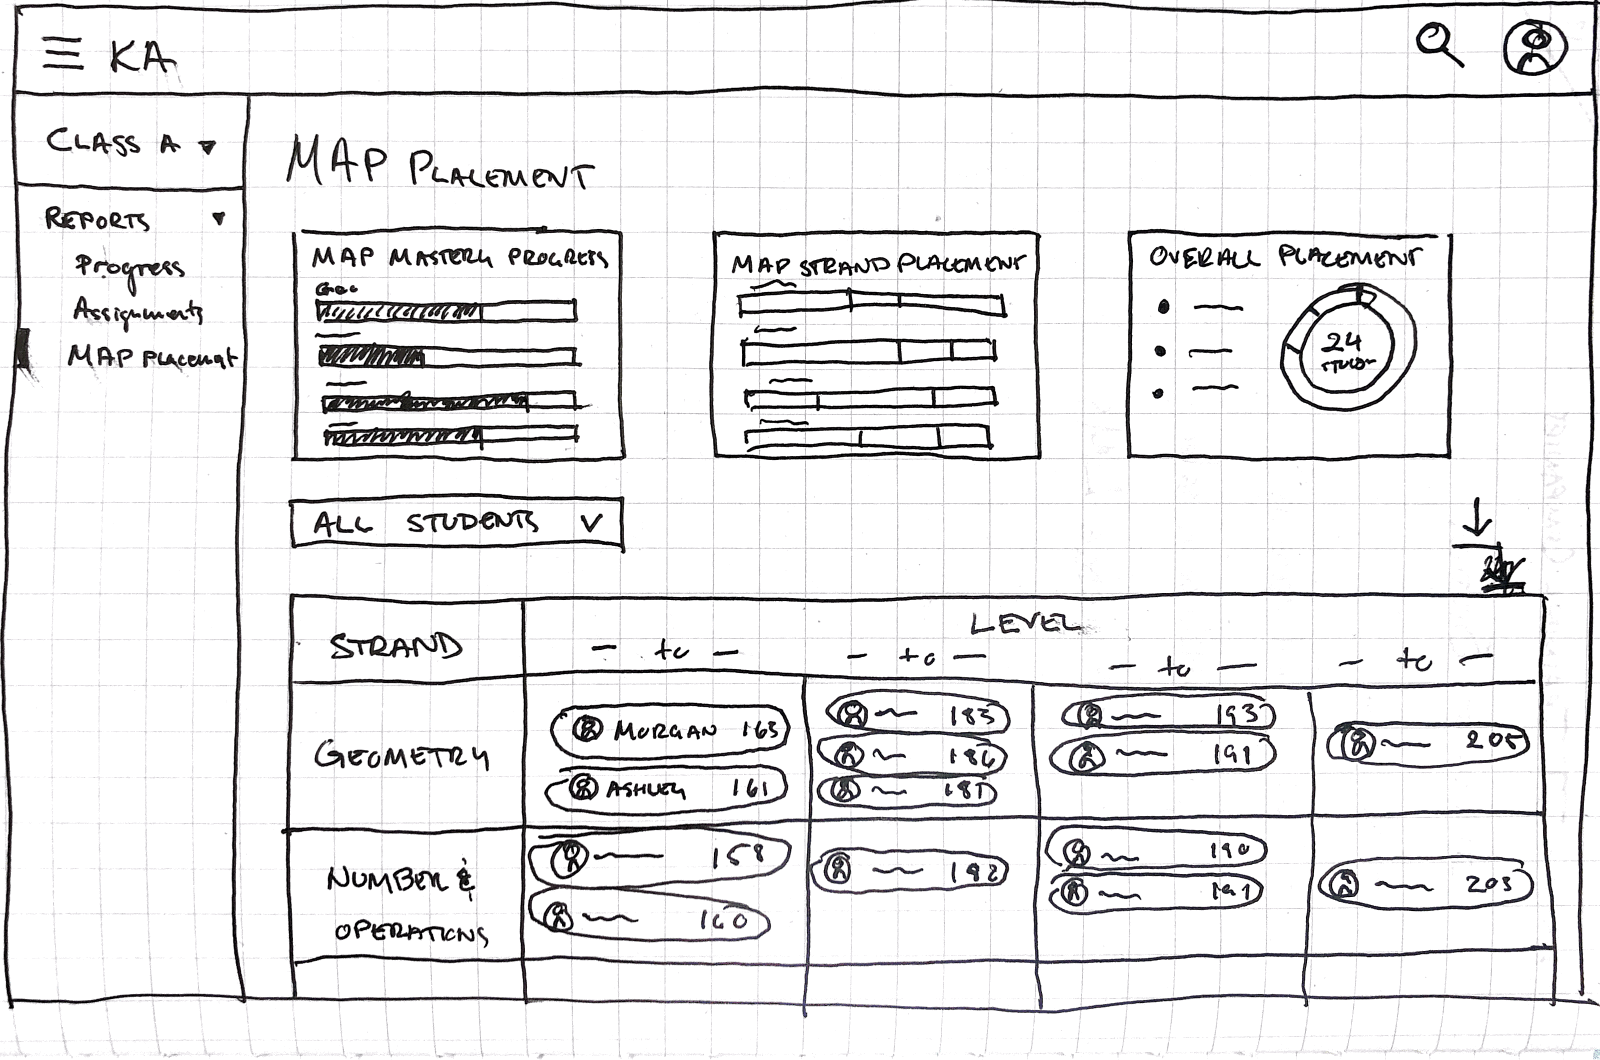
We learned from teachers that they wanted to get a sense of progress in tandem with where their students placed. This information would help them learn if a student was working on material that was too easy or too challenging. This also gave them more insight when they wanted to group similar students together for small group activities.
After this learning phase, we dove in head first into an Agile process to begin implementing designs. While we were comfortable with the user experience that we wanted to have for our MVP, our timelines brought forth some compromises to the rostering and placement flows that were core to teacher onboarding.
Shipped work
We ended up shipping an entirely new product that included the ability for not only districts to easily roster classrooms and connect them to Khan Academy but for teachers to easily place students at their learning edge and monitor their progress accordingly. We called this the placement, practice, progress feedback loop. Our hypothesis was that this feedback loop, if properly instrumented, would help students achieve their full potential by consistently placing them at their learning edge and solving for the one-size-fits-all challenges teachers face when instructing a group of wildly different students. Here are some of the experiences we designed for:
Outcome & next steps
MAP Accelerator launched its first pilot to 6 school districts in the Fall of 2019 to over 200 thousand students. That said, as an enterprise product, we had to develop different metrics for success from what we’re traditionally used to. Instead of indexing high on total users, we decided to place greater weight on the student activation rate and how many new students would become Monthly Very Active Learners (MVALs). MVALs include students who spend at least 120 minutes doing active learning on MAP Accelerator a month. Our target? 22% of licensed students. Our result? 23%. Overall, the pilot hit our success criteria giving us enough momentum to continue building on to the platform.
Like most times when we try something new, we learn something new. Working on this project definitely shed light on some growth opportunities for the organization and me!
Lesson 1: 2 non-profits can bite off more than they can chew
I think we were a bit over ambitious in terms of what we can accomplish and the realities of our resourcing capabilities. From exciting data visualizations to streamlined rostering, there were many areas of this project where we had to cut scope drastically.
Lesson 2: MAP Accelerator activation process
We didn’t do enough research to learn how teachers would be signing up their students on MAP Accelerator. In fact, our “edge case” of signing up via classroom code became the primary way teachers would link their students to a class! This was definitely an oversight on our end and an opportunity to advocate for more upfront research in the future.